


Trio Mobil Global Technology Innovation Leader in AI-Based Industrial Safety
Read the Frost & Sullivan Analysis

What Is the ROI of Forklift Safety? A Cost-and-Return Breakdown for Warehouse and Plant Leaders
 Aug 24, 2026
 3 min
3 min 493
493
Forklift safety has an operational cost. Forklift risk does too.
For warehouse and plant leaders, the financial question is therefore broader than the cost of adding another safety measure. It includes the potential cost of forklift-related injuries, equipment damage, downtime, operational disruption, and repeated high-risk interactions across the facility.
Current National Safety Council data show the scale of that exposure. Forklifts were the source of 84 work-related deaths in the United States in 2024 and 25,110 cases involving days away from work, job restriction, or transfer across 2023-2024.
For finance teams, however, incident statistics alone do not create a business case.
A stronger approach connects site-specific forklift exposure, incident costs, investment costs, and measurable changes in risk over time.
This guide explains how to calculate forklift safety ROI, which costs to include, how leading-risk data can strengthen the model, and where technologies such as AI, UWB, zone management, and forklift fleet monitoring can contribute.
What Is Forklift Safety ROI?
Forklift safety ROI is a financial framework used to compare the cost of a safety investment with the estimated financial value associated with reducing forklift-related risk.
The investment may include several layers of a forklift safety program, such as operator training, traffic management, physical controls, pedestrian detection, proximity awareness, speed management, and forklift tracking technologies.
A simplified ROI formula is:
ROI = (Estimated Financial Benefit - Cost of Investment) / Cost of Investment × 100
The formula is simple.
The challenge is establishing credible inputs for the financial benefit.
Unlike an investment that produces direct revenue, much of the value associated with safety comes from avoided costs, reduced disruption, reduced equipment damage, or better-managed operational exposure.
That means the model should be built around transparent assumptions rather than a single guaranteed return figure.
Before assigning financial value to individual technologies, see Choosing Forklift Safety Technology in 2026: A Decision Guide for Safety Leaders for a framework to match different solutions with specific operational risks.
Why Does Forklift Safety ROI Matter?
Forklift-related incidents create both human consequences and measurable operational costs.
National Safety Council data based on Bureau of Labor Statistics information show that forklifts remain a source of fatal and nonfatal occupational injuries. Because BLS changed parts of its injury classification system beginning in 2023, historical comparisons should be made carefully, but the latest figures still show substantial current exposure.
For a warehouse or manufacturing operation, the financial questions are practical:
- What has forklift-related injury and damage cost the organization historically?
- How much production time has been lost after forklift incidents or equipment impacts?
- Where are forklift-pedestrian interactions concentrated?
- How frequently do high-risk interactions occur without producing a formal incident report?
- Which safety investments can be measured against a reliable baseline?
Answering these questions turns forklift safety from a general budget category into a risk-management decision finance can evaluate.
What Costs Should Be Included in Forklift Safety ROI?
A credible forklift safety business case should consider more than medical costs following an injury.
OSHA’s $afety Pays methodology separates occupational injury costs into direct and indirect categories and uses an indirect-cost multiplier when estimating the financial impact of workplace injuries.
Direct Costs
Direct costs are generally easier to identify because they are visible in claims, invoices, maintenance records, or financial systems.
Depending on the event, they may include:
- Medical and treatment costs
- Workers’ compensation costs
- Forklift repair
- Racking or infrastructure repair
- Damaged materials or inventory
- Legal or claims-related expenses
Your organization’s own claims and maintenance history should be the primary source wherever sufficient data exists.
Indirect Costs
Indirect costs are often distributed across several departments and can therefore be less visible.
Depending on the organization and incident, they may include:
- Investigation time
- Supervisor and EHS resources
- Operational downtime
- Replacement labor
- Overtime
- Schedule disruption
- Administrative work
- Retraining or corrective-action activities
OSHA’s $afety Pays estimator explicitly recognizes that these indirect costs matter, while also cautioning that its estimates should not be treated as a detailed calculation for a specific organization.
Operational Costs
Forklift-related events can also create costs that sit outside traditional injury reporting.
For operations teams, these may be particularly relevant because they affect the daily performance of the facility.
Examples can include:
- Product or pallet damage
- Racking and infrastructure impacts
- Temporary closure of an aisle or operating area
- Equipment downtime
- Unplanned maintenance
- Disruption to material flow
Including these categories gives finance a more complete view of the exposure being evaluated.
What Does OSHA Require for Forklift Safety?
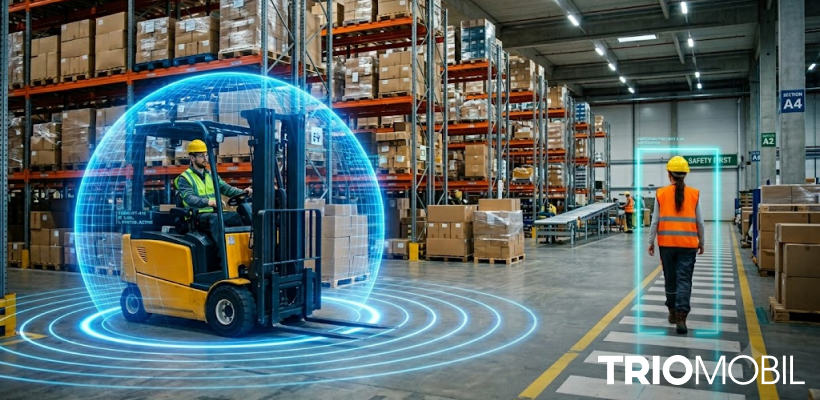
OSHA’s powered industrial truck standard, 29 CFR 1910.178, establishes requirements for the safe operation of powered industrial trucks, including operator training and evaluation.
Employers must ensure that operators are trained and competent for the equipment and workplace conditions they encounter. OSHA also requires operator performance evaluations at least once every three years and refresher training under defined circumstances, including certain accidents, near misses, unsafe operation, or workplace changes.
OSHA does not mandate a specific forklift proximity detection, AI camera, UWB, or collision-awareness technology.
Technology should therefore be evaluated as one component of a broader safety program that may also include:
- Operator training and evaluation
- Traffic-management procedures
- Pedestrian segregation
- Signs and markings
- Physical barriers
- Speed-management policies
- Engineering controls
- Monitoring and detection technologies
Compliance depends on the organization’s complete safety program and operating practices rather than the deployment of any single technology.
Reactive vs. Data-Driven Forklift Safety
The financial model changes depending on whether forklift safety decisions are driven mainly by incidents or by ongoing exposure data.
Both historical incident information and leading indicators are useful, but they answer different questions.
| Reactive Safety View | Data-Driven Safety View |
|---|---|
| Starts with incidents that already occurred | Also examines recurring high-risk interactions |
| Relies heavily on incident reports | Adds proximity, near-miss, zone, impact, and vehicle data |
| Measures injury and damage outcomes | Tracks exposure before an outcome occurs |
| Investment often follows a specific event | Investment can be prioritized by recurring risk patterns |
| Evaluation focuses on incident counts | Evaluation can include changes in leading-risk indicators |
A data-driven model does not replace traditional incident analysis.
It adds another layer of information that can help teams understand where risk repeatedly develops during normal operations.
How Do You Calculate Forklift Safety ROI?
A defensible forklift safety ROI model can be built in five steps.
Each step should use internal data where possible and clearly identify external assumptions where internal information is unavailable.
1. Establish Your Current Forklift Risk Baseline
Start with the operating conditions that create forklift exposure across the facility.
Depending on available data, the baseline may include:
- Forklift-related injuries
- Forklift-pedestrian near misses
- Equipment impacts
- Property or racking damage
- High-risk proximity events
- Speed-related events
- High-risk intersections
- Restricted-zone activity
- Forklift-forklift interactions
The objective is to understand both historical outcomes and recurring exposure.
Identifying where exposure occurs is the first step toward building that baseline. The Invisible Risk Map: 10 Areas Where Forklift Risk Often Hides explores common areas where forklift risk can develop across an operation.
2. Calculate Historical Incident and Damage Costs
Next, determine what forklift-related events have actually cost the operation.
Use internal records wherever possible.
Relevant sources may include:
- Workers’ compensation records
- Insurance claims
- Maintenance data
- Damage records
- Downtime reports
- Labor costs
- Investigation records
- Replacement equipment costs
Where internal cost information is incomplete, tools such as OSHA’s $afety Pays estimator can provide useful reference points.
Industry estimates should remain supporting inputs rather than replacements for site-specific data.
3. Calculate the Total Cost of the Safety Investment
The investment side should also be fully loaded.
Depending on the program, this may include:
- Hardware
- Software or subscriptions
- Installation
- System integration
- Training
- Infrastructure changes
- Maintenance
- Internal implementation resources
Comparing a fully loaded benefit estimate against only the hardware purchase price will overstate ROI.
Both sides of the calculation should use comparable cost assumptions.
4. Define the Measurable Change
The next step is deciding how improvement will be measured.
This is particularly important for technologies designed to provide leading-risk information.
Relevant indicators might include:
- High-risk forklift-pedestrian interactions
- Repeat proximity events
- Near-miss frequency
- Equipment impacts
- Speed events
- High-risk zone activity
- Vehicle utilization
- Repeated exposure by shift, zone, or vehicle
A reduction in one of these indicators should not automatically be translated into an equivalent percentage reduction in injuries.
Instead, it provides evidence that a defined form of operational exposure is changing.
For a closer look at how near misses and other leading indicators can reveal higher-severity exposure, read What Is a SIF Precursor? AI-Based Near-Miss Detection in Forklift Safety.
5. Build Conservative, Base, and Higher-Impact Scenarios
Finance teams frequently evaluate investments under several scenarios rather than relying on one forecast.
Forklift safety can be modeled the same way.
For example:
Conservative scenario: Limited reduction in equipment damage and high-risk interactions.
Base scenario: Measurable improvement in selected leading-risk indicators plus lower historical incident-related costs.
Higher-impact scenario: Stronger improvement where repeated exposures, damage, and operational disruption are significantly reduced.
This structure makes assumptions visible and allows finance to test how sensitive the ROI is to different outcomes.
What Could a Forklift Safety ROI Model Look Like?
A simple model can help translate the framework into financial terms.
The example below is illustrative only. Actual figures should come from the organization’s own operating and claims data.
Assume a facility identifies:
- $90,000 per year in historical forklift-related damage, downtime, and injury costs
- $20,000 per year in additional internal labor and investigation costs
- $60,000 annualized cost for the proposed safety program
The facility therefore has $110,000 in identified annual historical costs associated with the categories being evaluated.
If the organization models a scenario in which measurable improvements correspond to $75,000 in annual avoided costs, the calculation would be:
ROI = ($75,000 - $60,000) / $60,000 × 100
Illustrative ROI = 25%
That figure is not a prediction.
It becomes defensible only when the $75,000 assumption can be supported by the organization’s historical costs, operating data, and measured changes after implementation.
This is why baseline data matters.
Where Does Real-Time Visibility Improve Forklift ROI Analysis?
Many forklift ROI models have good cost data but weak exposure data.
An organization may know how much the last incident cost while having limited information about how often similar conditions occur during everyday operations.
Continuous monitoring can help fill part of that gap.
Depending on the technology and system configuration, teams can collect information on:
- Forklift-pedestrian proximity
- Forklift-forklift interactions
- Zone activity
- Equipment impacts
- Speed-related events
- Near-miss patterns
- Vehicle utilization
- Repeated risk by location or time period
This creates a measurable baseline before an intervention and a reference point for evaluating changes afterward.
For finance, that means the ROI conversation can use both historical cost information and current operational exposure data.
Learn how What are Forklift Monitoring Systems? Why are They Essential for Modern Warehouses? explains the role of continuous vehicle and operational data in improving fleet visibility.
How Trio Mobil Supports Forklift Safety ROI Analysis
Trio Mobil combines multiple technologies designed to support forklift risk visibility, operator awareness, and ongoing safety analysis.
The appropriate configuration depends on site layout, vehicle type, traffic patterns, identified risks, and integration requirements.
Trio Safe AI
Trio Safe AI combines AI-based visual detection with UWB proximity technology to support awareness around forklifts, pedestrians, and other moving equipment.
Depending on configuration, capabilities can include:
- Tagless AI pedestrian detection within configured camera fields of view
- UWB-based pedestrian proximity detection
- Forklift-forklift proximity awareness
- Audio and visual alerts
- Smart zone management
- Automatic slowdown when compatible vehicle integration is enabled
- Safety event and interaction data
These capabilities can help safety teams identify where high-risk forklift interactions recur and track changes over time.
FleetBridge
FleetBridge provides operational visibility across the forklift fleet, adding vehicle-level context to the safety analysis.
Depending on configuration, the platform can support areas including:
- Forklift utilization
- Impact monitoring
- Operator access control
- Pre-operation checklists
- Real-time alarms
- Historical fleet reporting
This data can help organizations understand relationships between equipment use, operational conditions, and recurring safety events.
Layered AI and UWB
AI and UWB provide different types of information.
AI-powered risk monitoring can identify pedestrians and interpret visual conditions within configured camera coverage. UWB provides precise proximity information between equipped devices and can operate without depending on visual line of sight.
Using the technologies together can provide a broader view of forklift risk in complex environments.
For a deeper comparison, see How Layered AI and UWB Systems Improve Forklift Safety at Scale.
Organizations comparing different technologies can also read Forklift Collision Avoidance Technologies in 2026.
What Business Outcomes Should You Track?
The strongest ROI model combines safety indicators with operational and financial metrics.
The objective is to understand whether the investment is changing the conditions it was designed to address.
Useful measures may include:
- Leading-risk exposure: Are defined high-risk forklift interactions becoming less frequent?
- Equipment damage: Are forklift, rack, pallet, or infrastructure damage costs changing?
- Impact events: Are repeated vehicle impacts decreasing?
- Operational disruption: Is forklift-related downtime changing?
- Risk concentration: Are specific zones, shifts, or vehicles continuing to generate disproportionate exposure?
- Program adoption: Are alerts, controls, training, and corrective actions being consistently incorporated into operations?
Tracking these metrics over time creates a stronger basis for subsequent investment decisions.
How Should Forklift Safety ROI Be Presented to Finance?
A finance-ready business case should make both the potential value and the uncertainty visible.
The presentation should clearly answer a small number of questions.
- What specific forklift exposure are we addressing?
- What is our current baseline?
- What has that exposure historically cost us?
- What will the intervention cost over its expected operating period?
- Which metrics will show whether exposure is changing?
- Which assumptions are based on internal data and which use external benchmarks?
That structure is more defensible than presenting a generic industry ROI percentage.
It also gives the organization a model that can improve as more site-specific data becomes available.
From Forklift Risk to a Measurable Business Case
Forklift safety investment becomes easier to evaluate when operational exposure and financial impact are measured together.
Incident history shows what has already happened. Leading-risk data can provide additional visibility into the interactions and operating conditions occurring before an incident.
Together, these inputs can help safety, operations, and finance teams evaluate forklift safety investments using a common framework.
Trio Mobil’s AI, UWB, zone management, and fleet monitoring technologies are designed to support this visibility as part of a broader forklift safety strategy.
Talk to our team to explore how forklift safety data can support your risk assessment and investment planning.
Key Takeaways
A strong forklift safety ROI model uses site-specific risk and cost data rather than relying on generic savings claims.
- Forklift safety ROI compares estimated financial benefits with the fully loaded cost of the safety investment.
- Current NSC data show that forklifts remain a significant source of fatal and nonfatal workplace injury.
- Direct, indirect, and operational costs should all be considered where they can be supported by organizational data.
- OSHA requires appropriate powered industrial truck training and safe operation but does not mandate a particular detection technology.
- Leading-risk data can complement incident records by showing where forklift exposure repeatedly occurs.
- AI, UWB, zone management, and fleet data provide different layers of operational visibility.
- Scenario-based ROI modeling is generally more defensible than promising a fixed return.
Frequently Asked Questions
Calculate the estimated financial benefit associated with the intervention, subtract the total cost of the investment, and divide the result by the investment cost. Use organization-specific incident, damage, downtime, and operational data wherever possible.
Relevant costs may include injuries, workers’ compensation, equipment and property damage, investigation time, downtime, replacement labor, maintenance, and other documented operational impacts. The categories used should reflect the organization’s actual experience.
No. OSHA’s 29 CFR 1910.178 establishes requirements for powered industrial truck operation, training, and evaluation but does not mandate a specific AI, UWB, proximity detection, or collision-awareness technology.
Yes. Near-miss and other leading-risk data can help establish how frequently defined high-risk conditions occur. They should be treated as indicators of exposure rather than automatically converted into a fixed number of injuries avoided.
No. Financial results depend on the site’s risk profile, historical costs, system configuration, implementation, operational practices, and how consistently the resulting information is used.
Depending on configuration, Trio Safe AI and FleetBridge can provide data on proximity events, forklift-pedestrian interactions, impacts, zones, vehicle activity, and other operational indicators. These data can help establish baselines and evaluate changes over time as part of a broader safety program.
References
- National Safety Council. Injury Facts: Forklifts.
- Occupational Safety and Health Administration. 29 CFR 1910.178 - Powered Industrial Trucks.
- Occupational Safety and Health Administration. $afety Pays Individual Injury Estimator.
- Occupational Safety and Health Administration. Powered Industrial Truck Operator Training; Final Rule.
- Industrial Truck Standards Development Foundation. ANSI/ITSDF B56 Standards.
Industry statistics and cost estimates should be validated against an organization’s own claims, insurance, maintenance, incident, and operational data before they are used in a financial investment decision.

Product Catalogue 2026
Download our catalog and gain access to a wealth of information on how to enhance industrial safety and efficiency. Our latest catalog features a diverse range of products and services that can help you achieve your goals.
Our Latest Blogs


Learn more about Trio Mobil's Solutions
Fill out the form and we'll contact you!